About the Survey
Why we did the survey
To Understand
Emergency management is evolving. We have an opportunity to capture key learnings and continue advancing our shared mission of cultivating disaster resilience on our campuses.
To Build
We can build on the 2016 and 2022 National Emergency Management Needs Assessments. The 2016 and 2022 surveys done in partnership with the National Center for Campus Public Safety and our professional association partners, provide a solid longitudinal base on which to build. Now is a good time to resurvey practitioners and develop a cornerstone for future DRU activities.
To Adapt
The DRU can evolve its core competencies to advance interdisciplinary partnership and disaster resilience in Institutions of Higher Education (IHEs). Information from surveys such as this one can inform how the DRU can better serve IHEs.
Survey Overview
Notable Metadata
- 38 Questions
- 23 days (October 15-November 16, 2024)
- 297 respondents
About the Survey Respondents
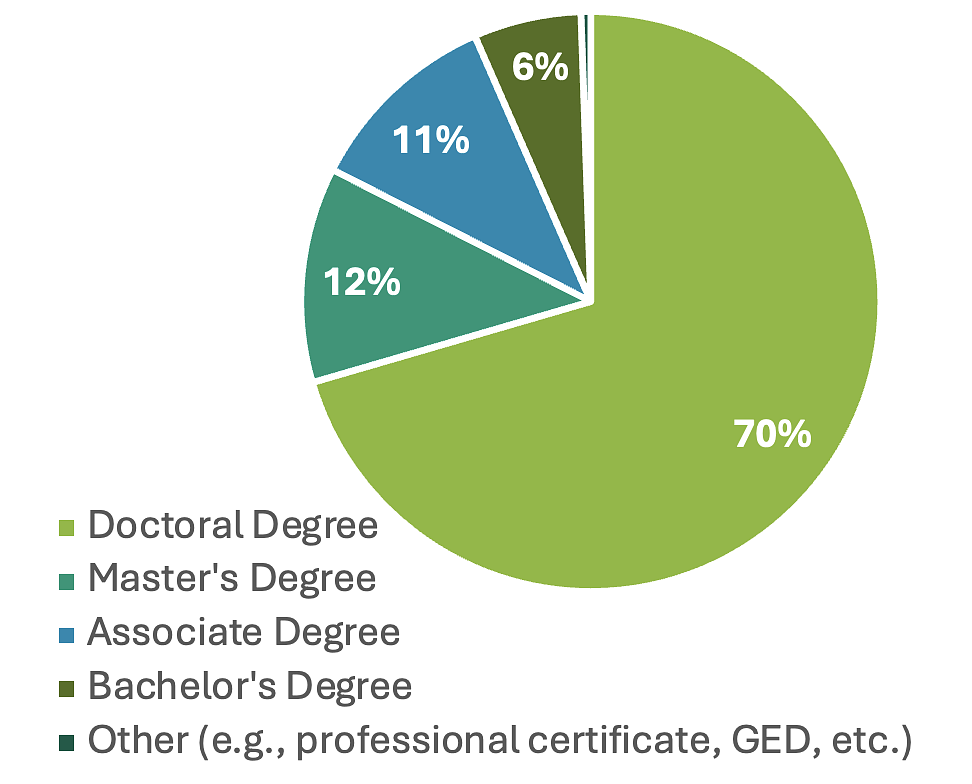
Degree Type | Percentage of Respondents |
|---|---|
Doctoral Degree | 70% |
Master's Degree | 12% |
Associate Degree | 11% |
Bachelor's Degree | 6% |
Other (e.g. professional certificate, GED, etc.) | < 1% |
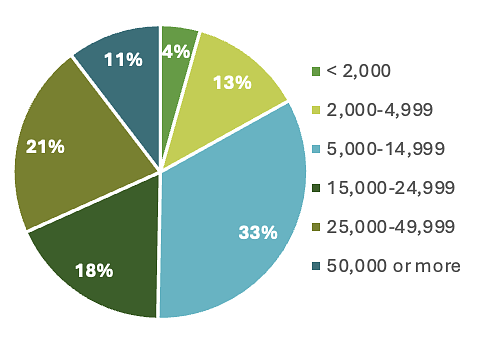
Student Enrollment | Percentage of Respondents |
|---|---|
50,000 or more | 11% |
25,000-49,999 | 21% |
15,000-24,999 | 18% |
5,000-14,999 | 33% |
2,000-4,999 | 13% |
< 2,000 | 4% |
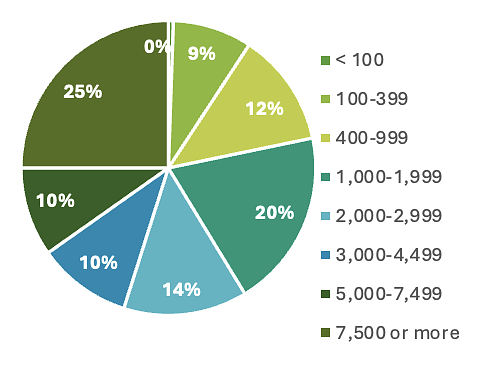
Number of Faculty and Staff | Percentage of Respondents |
|---|---|
7,500 or more | 25% |
5,000-7,499 | 10% |
4,499-3,000 | 10% |
2,999-2,000 | 14% |
1,999-1,000 | 20% |
400-999 | 12% |
100-399 | 9% |
< 100 | < 1% |
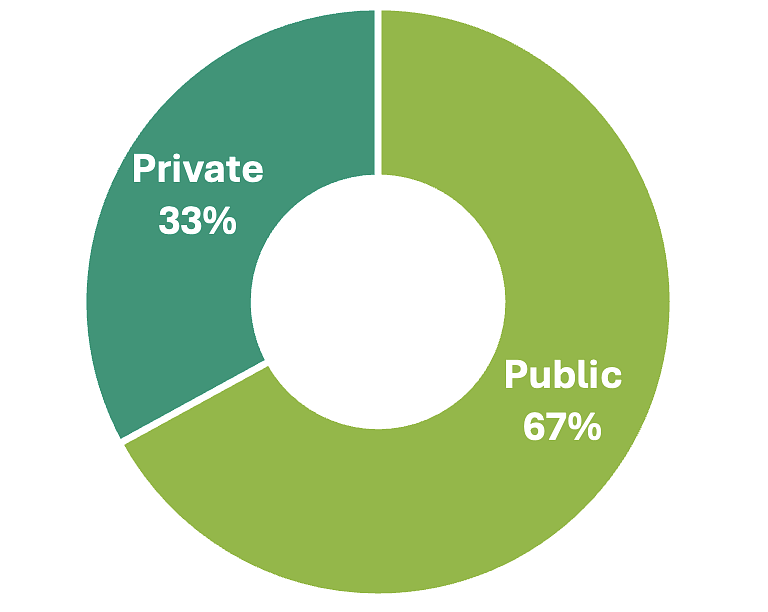
Type of Institution | Percentage of Respondents |
|---|---|
Public | 67% |
Private | 33% |
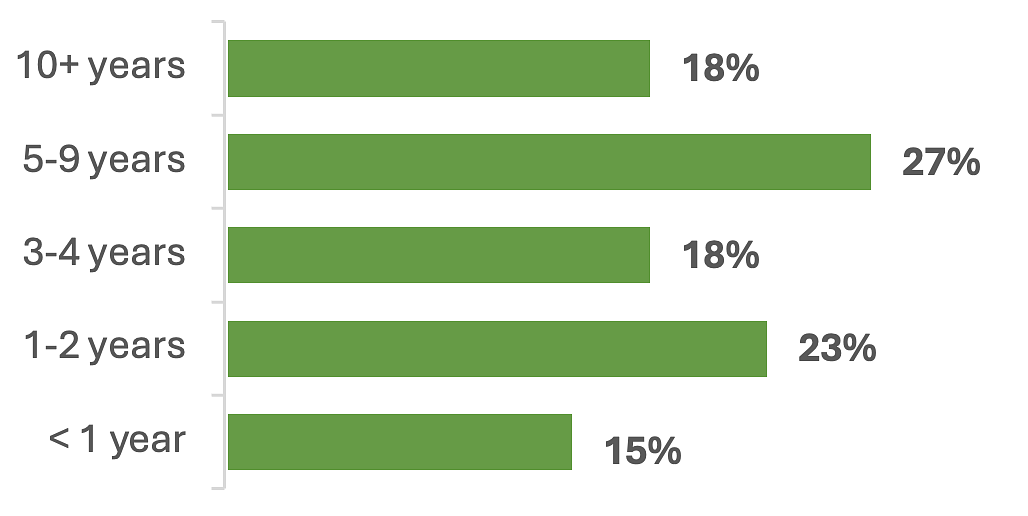
Amount of Time | Percentage of Respondents |
|---|---|
10+ Years | 18% |
5-9 Years | 27% |
3-4 Years | 18% |
1-2 Years | 23% |
< 1 Year | 15% |
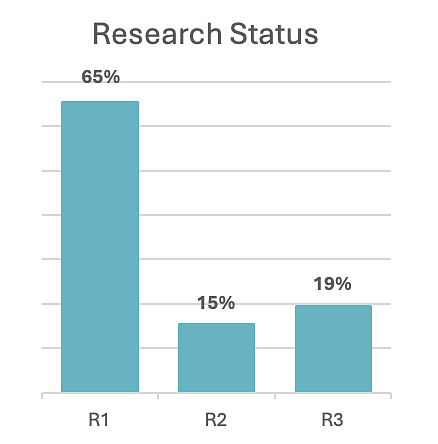
Institution Research Status | Percentage of Respondents |
|---|---|
R1 | 65% |
R2 | 15% |
R3 | 19% |

State or Area | Number of Respondents |
|---|---|
Oregon | 17 |
California | 17 |
Texas | 13 |
Massachusetts | 12 |
Illinois | 10 |
Virginia | 9 |
Washington | 8 |
New York | 7 |
Pennsylvania | 6 |
Arizona | 5 |
Non-US | 5 |
State | Number of Respondents |
|---|---|
North Carolina | 5 |
Tennessee | 5 |
Kansas | 4 |
Louisiana | 4 |
New Jersey | 4 |
Oklahoma | 4 |
Rhode Island | 4 |
Wisconsin | 4 |
Florida | 3 |
Nebraska | 3 |
New Hampshire | 3 |
Utah | 3 |
Arkansas | 2 |
Indiana | 2 |
Iowa | 2 |
State | Number of Respondents |
|---|---|
Maryland | 2 |
Michigan | 2 |
Missouri | 2 |
Colorado | 1 |
Connecticut | 1 |
District of Columbia | 1 |
Idaho | 1 |
Kentucky | 1 |
Minnesota | 1 |
Mississippi | 1 |
Nevada | 1 |
New Mexico | 1 |
North Dakota | 1 |
Ohio | 1 |
South Dakota | 1 |
Vermont | 1 |
Additional information about our respondents
- 32% of respondents were from IHEs with medical teaching centers
- 84% had residential campuses
- 34% average proportion of students living on campus
Key Findings
Where Emergency Management Programs Live
Key takeaway: Most (52%) respondents said their emergency management programs are part of public safety or campus police departments, and this trend appears to have increased since 2022. However, many respondents said their EM departments live in other parts of their IHEs.
Within which department does the emergency management function reside at your institution?
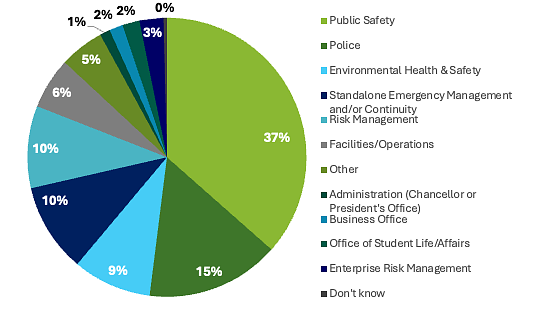
Department | Percentage of Respondents |
|---|---|
Public Safety | 37% |
Police | 15% |
Environmental Health and Safety | 9% |
Standalone | 10% |
Risk Management | 10% |
Facilities/Operations | 6% |
Other | 5% |
Administration | 1% |
Business Office | 2% |
Office of Student Life/Affairs | 2% |
Enterprise Risk Management | 3% |
Don't Know | 0% |
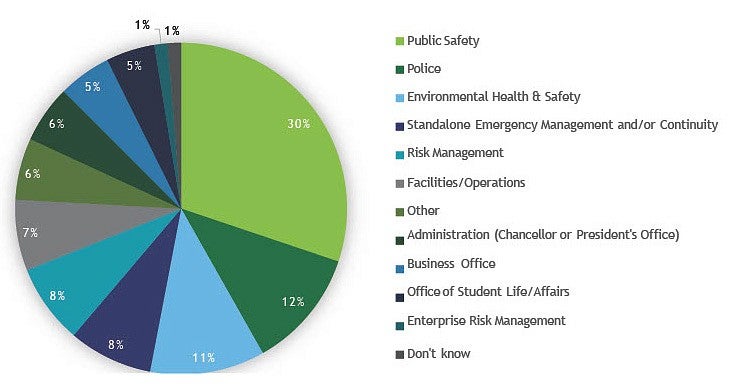
Department | Percentage of respondents |
|---|---|
Public Safety | 30% |
Police | 12% |
Environmental Health and Safety | 11% |
Standalone | 8% |
Risk Management | 8% |
Facilities/Operations | 7% |
Other | 6% |
Administration | 6% |
Business Office | 5% |
Office of Student Life/Affairs | 5% |
Enterprise Risk Management | 1% |
Don't Know | 1% |
Where Should Emergency Management Live?
Key takeaway: Most respondents (75%) said their emergency management departments are housed in the right place. However, one in four think their emergency management programs should reside in another part of the IHE - most often as standalone entities.
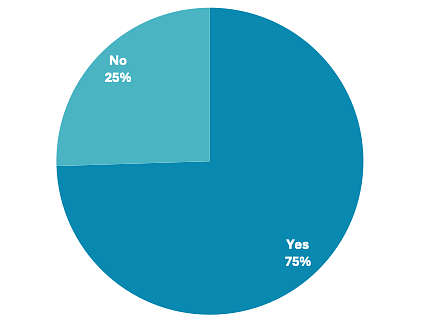
Yes - 75%
No - 25%
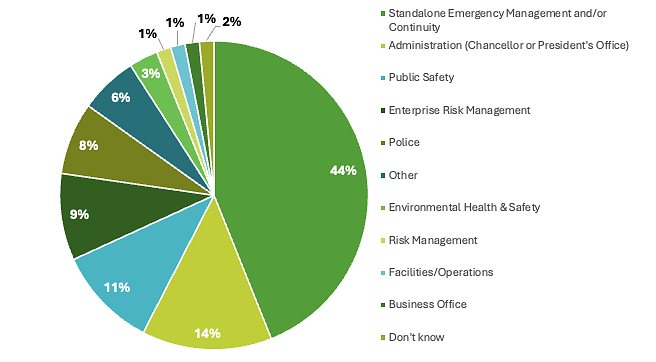
Where Emergency Management Departments Should Reside According to Respondents | Percentage of Respondents |
|---|---|
Standalone Emergency Management and/or Continuity | 44% |
Administration (Chancellor or President's Office) | 14% |
Public Safety | 11% |
Enterprise Risk Management | 9% |
Police | 8% |
Other | 6% |
Environmental Health and Safety | 3% |
Risk Management | 1% |
Facilities/Operations | 1% |
Business Office | 1% |
Don't Know | 2% |
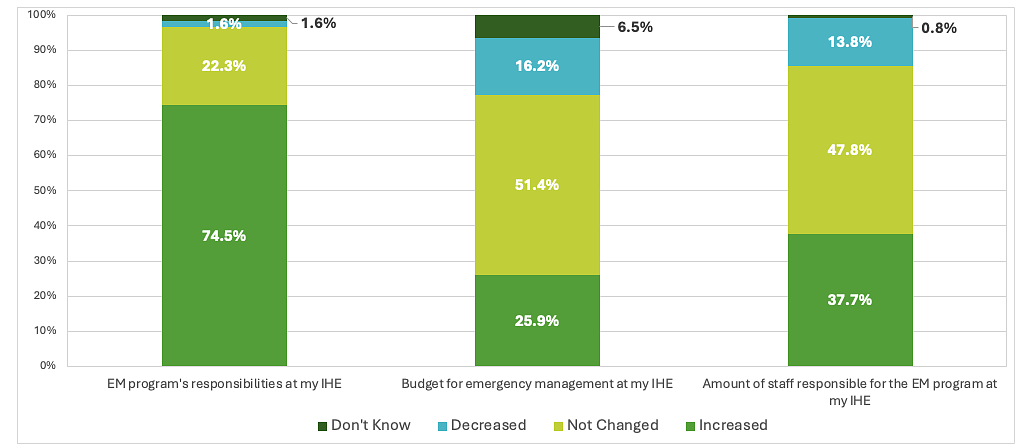
Workload Changes in the Last Three Years
Key takeaway: The majority of respondents said their emergency management departments have become responsible for more things in the last three years. Most also said their budgets and staff sizes have either stayed the same or decreased.
Type of WorkLoad Change | Increased | Not Changed | Decreased | Don't Know |
|---|---|---|---|---|
Emergency management program's responsibilities at my IHE | 74.5% | 22.3% | 1.6% | 1.6% |
Budget for emergency management at my IHE | 25.9% | 51.4% | 16.2% | 6.5% |
Amount of staff responsible for the emergency management program at my IHE | 37.7% | 47.8% | 13.8% | 0.8% |
Emergency Management Leadership Roles
Key takeaway: Respondents said their emergency management teams most often take the lead when it comes to exercises, policy development, and trainings. However, many respondents also said their emergency management departments either do not lead or do not have a role in climate change planning, international emergency response, planning for survivor assistance, or recovery planning.
- Exercises (e.g. tabletop, functional, etc.)
- Development of institutional EM policy(s)
- Training - emergency response (e.g. ICS)
- Training - preparedness (for campus staff)
- Training - institutional leadership (e.g. policy group)
- Survivor assistance planning
- International emergency response planning
- Predisaster mitigation planning
- Recovery planning
- Continuity planning
- Climate change/adaptation planning
- International emergency response planning
- Survivor assistance planning
- Continuity planning
- Recovery planning
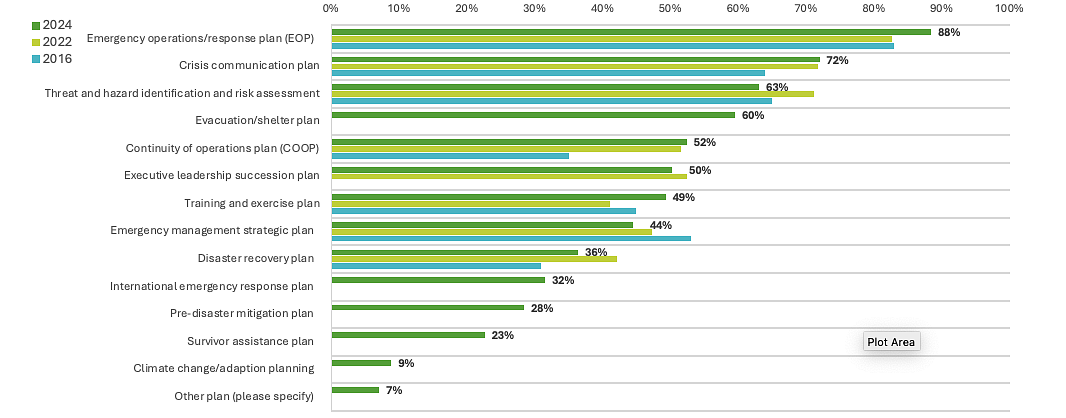
Common Emergency Management Program Elements
Key takeaway: Most emergency management programs include an EOP, a crisis communication plan, THIRA, evacuation plan, and COOP. Since the 2016 survey, the number of IHEs with emergency management strategic plans has decreased.
Type of Plan | 2024 Percent of REspondents | 2022 Percent of REspondents | 2016 Percent of Respondents |
|---|---|---|---|
Emergency Operations/Response Plan (EOP) | 88% | 83% | 83% |
Crisis Communications Plan | 72% | 72% | 64% |
Threat and Hazard Identification and Risk Assessment | 63% | 71% | 65% |
Evacuation/Shelter Plan | 60% | n/a | n/a |
Continuity of Operations Plan (COOP) | 52% | 52% | 35% |
Executive Leadership Succession Plan | 50% | 53% | n/a |
Training and Exercise Plan | 49% | 41% | 45% |
Emergency Management Strategic Plan | 44% | 47% | 53% |
Disaster Recovery Plan | 36% | 42% | 31% |
International Emergency Response Plan | 32% | n/a | n/a |
Pre-Disaster Mitigation Plan | 28% | n/a | n/a |
Survivor Assistance Plan | 23% | n/a | n/a |
Climate Change/Adaptation Planning | 9% | n/a | n/a |
Other Plan (Please Specify) | 7% | n/a | n/a |
Common Emergency Management Program Elements
- 84% have incident management teams (IMTs)
- 86% have emergency operations centers (EOCs)
- 78% have virtual EOCs (VEOCs)
- 2 -median number of full-time employees (average =6.5)
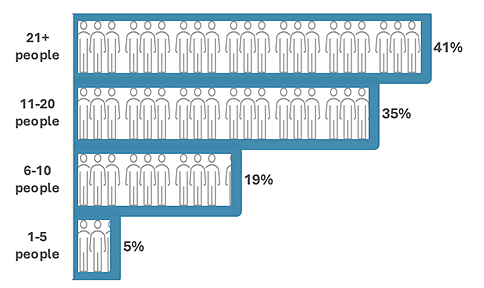
Number of People | Percentage of Respondents |
|---|---|
21+ | 41% |
11-20 | 35% |
6-10 | 19% |
1-5 | 5% |
Improving IMTs and Crisis Response Teams
Key takeaway: Well over half the respondents said their IMTs need to do more training or improve the quality of their training in order to improve their incident management teams or crisis response teams. Better leadership support, funding, staffing, and technology were also top of mind for many.
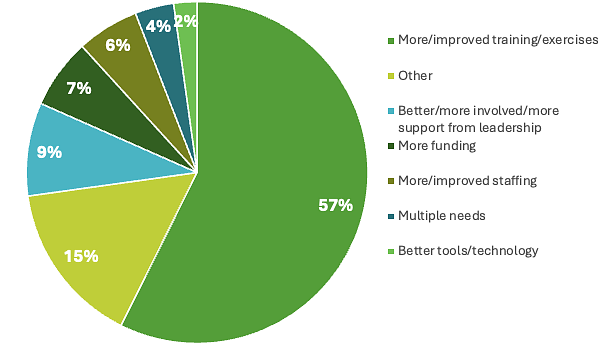
Way to Improve IMT or Crisis Response Team | Percentage of Respondents |
|---|---|
More/improved training/exercises | 57% |
Other | 15% |
Better/more involved/more support from leadership | 9% |
More funding | 7% |
More/improved staffing | 6% |
Multiple Needs | 4% |
Better tools/technology | 2% |
"More time dedicated to exercises - we're lucky to get four hours at a time a couple times per year."
"The emergency operations group shows up to exercises and 90% know their roles. It's the senior management group that doesn't fully participate in the exercises, and the policy-level decision-making processes need to be explored before incidents occur. We schedule exercises with leadership to ensure availability, but things come up/the exercise isn't important enough to stay on calendars."
"The team is well supported, but we would benefit from clear and visible support from the university president encouraging IMT members to continue their participation on the team and to demonstrate his value of the team."
Common Reasons for Past EOC Activations
Key takeaway: Though many respondents said their IHEs have activated their EOCs for anything they deemed an emergency, many respondents provided more specific information about why they activate their EOCs. Weather and natural hazard events were the most common reasons, as were large or controversial events, protests, and outages. Many respondents said their IHEs activate their EOCs for athletic events and commencement.
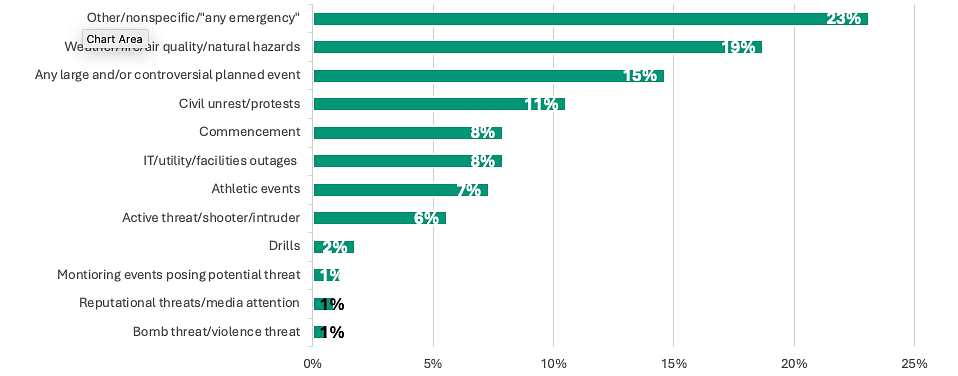
Type of Emergency or Event | Percentage of Respondents |
|---|---|
Other/Nonspecific/"Any Emergency" | 23% |
Weather/Fire/Air Quality/Natural Hazards | 19% |
Any large and/or controversial planned event | 15% |
Civil Unrest/Protests | 11% |
Commencement | 8% |
IT/Utility/Facilities Outages | 8% |
Athletic Events | 7% |
Active Threat/Shooter/Intruder | 6% |
Drills | 2% |
Monitoring events posing potential threat | 1% |
Reputational Threats/Media Attention | 1% |
Bomb Threat/Violence Threat | 1% |
Pre-disaster Mitigation and Preparedness Plan Needs
Key takeaway: Plan development and help with best practices or sample plans are the largest needs in this area, according to the respondents.
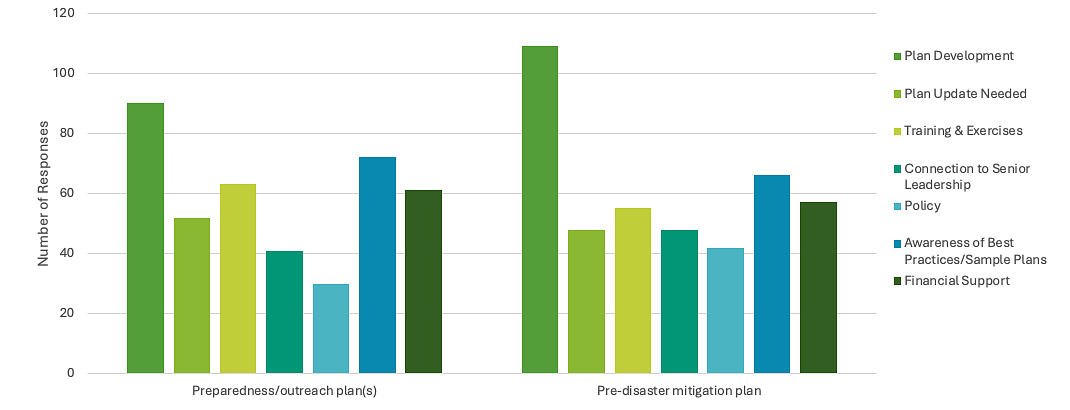
Plan Needs | Number of Responses |
|---|---|
Plan Development | 90 |
Plan Update | 52 |
Training and Exercises | 63 |
Connection to Senior Leadership | 41 |
Policy | 30 |
Awareness of Best Practices/Sample Plans | 72 |
Financial Support | 61 |
Plan Needs | Number of Responses |
|---|---|
Plan Development | 109 |
Plan Update | 48 |
Training and Exercises | 55 |
Connection to Senior Leadership | 48 |
Policy | 42 |
Awareness of Best Practices/Sample Plans | 66 |
Financial Support | 57 |
Emergency Response Program Needs
Key takeaway: Plan updates and training are some of the biggest needs in several of the core areas of response programs.
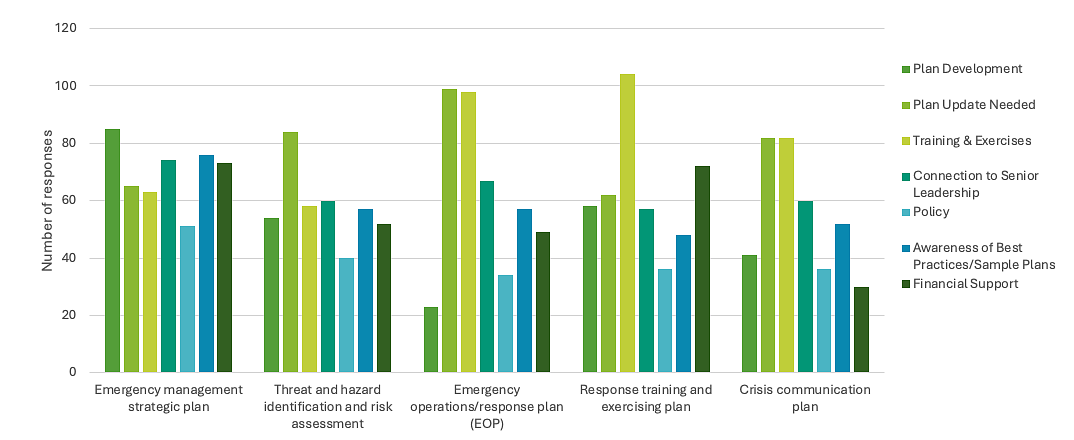
Program Needs | Number of Responses |
|---|---|
Plan Development | 85 |
Plan Update | 65 |
Training and Exercises | 63 |
Connection to Senior Leadership | 74 |
Policy | 51 |
Awareness of Best Practices/Sample Plans | 76 |
Financial Support | 73 |
Program Needs | Number of Responses |
|---|---|
Plan Development | 54 |
Plan Update | 84 |
Training and Exercises | 58 |
Connection to Senior Leadership | 60 |
Policy | 40 |
Awareness of Best Practices/Sample Plans | 57 |
Financial Support | 52 |
Program Needs | Number of Responses |
|---|---|
Plan Development | 23 |
Plan Update | 99 |
Training and Exercises | 98 |
Connection to Senior Leadership | 67 |
Policy | 34 |
Awareness of Best Practices/Sample Plans | 57 |
Financial Support | 49 |
Program Needs | Number of Responses |
|---|---|
Plan Development | 58 |
Plan Update | 62 |
Training and Exercises | 104 |
Connection to Senior Leadership | 57 |
Policy | 36 |
Awareness of Best Practices/Sample Plans | 48 |
Financial Support | 72 |
Program Needs | Number of Responses |
|---|---|
Plan Development | 41 |
Plan Update | 82 |
Training and Exercises | 82 |
Connection to Senior Leadership | 60 |
Policy | 36 |
Awareness of Best Practices/Sample Plans | 52 |
Financial Support | 30 |
Continuity of Operations (COOP) Needs
Key takeaways: Many respondents said plan updates and training are some of the biggest needs in several of the core areas of their COOP programs. Plan development around research enterprise and executive succession were also notable needs.
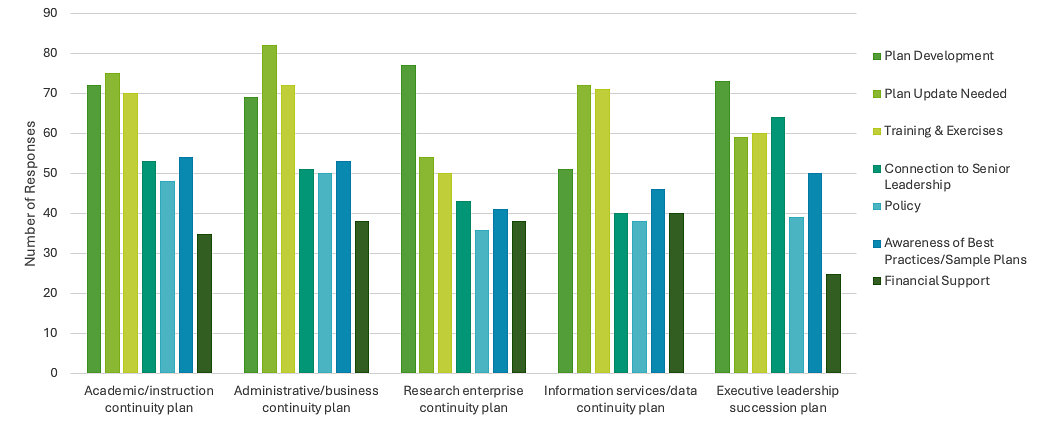
Program Needs | Number of Responses |
|---|---|
Plan Development | 72 |
Plan Update | 75 |
Training and Exercises | 70 |
Connection to Senior Leadership | 53 |
Policy | 48 |
Awareness of Best Practices/Sample Plans | 54 |
Financial Support | 35 |
Program Needs | Number of Responses |
|---|---|
Plan Development | 69 |
Plan Update | 82 |
Training and Exercises | 72 |
Connection to Senior Leadership | 51 |
Policy | 50 |
Awareness of Best Practices/Sample Plans | 53 |
Financial Support | 38 |
Program Needs | Number of Responses |
|---|---|
Plan Development | 77 |
Plan Update | 54 |
Training and Exercises | 50 |
Connection to Senior Leadership | 43 |
Policy | 36 |
Awareness of Best Practices/Sample Plans | 41 |
Financial Support | 38 |
Program Needs | Number of Responses |
|---|---|
Plan Development | 51 |
Plan Update | 72 |
Training and Exercises | 71 |
Connection to Senior Leadership | 40 |
Policy | 38 |
Awareness of Best Practices/Sample Plans | 46 |
Financial Support | 40 |
Program Needs | Number of Responses |
|---|---|
Plan Development | 73 |
Plan Update | 59 |
Training and Exercises | 60 |
Connection to Senior Leadership | 64 |
Policy | 39 |
Awareness of Best Practices/Sample Plans | 50 |
Financial Support | 25 |
Disaster Recovery Plan Needs
Key takeaway: Plan development, training, and plan updates are prominent needs in this area, according to the respondents.
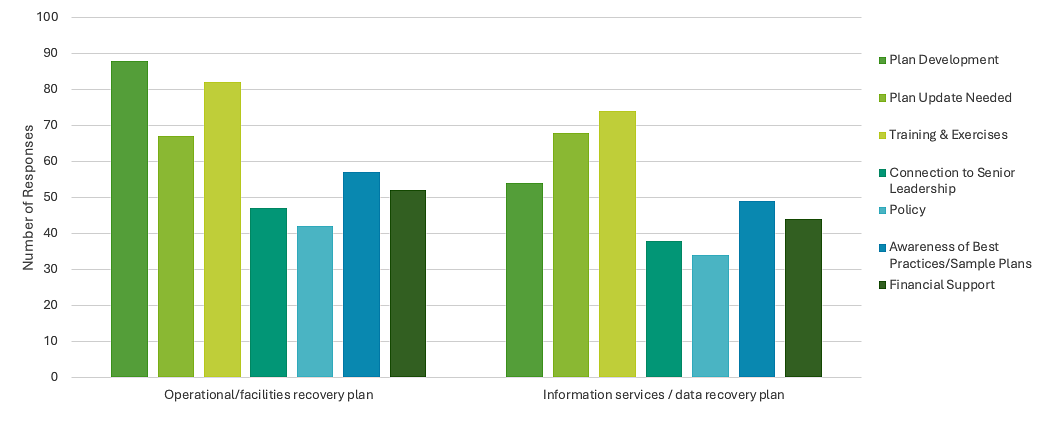
Plan Needs | Number of Responses |
|---|---|
Plan Development | 88 |
Plan Update | 67 |
Training and Exercises | 82 |
Connection to Senior Leadership | 47 |
Policy | 42 |
Awareness of Best Practices/Sample Plans | 57 |
Financial Support | 52 |
Plan Needs | Number of Responses |
|---|---|
Plan Development | 54 |
Plan Update | 68 |
Training and Exercises | 74 |
Connection to Senior Leadership | 38 |
Policy | 34 |
Awareness of Best Practices/Sample Plans | 49 |
Financial Support | 44 |
Emergency Management Standards
Key takeaway: Standards from the National Weather Service and FEMA top the list; EMAP, ISO, and the UCC Crosswalk were the least popular among respondents.
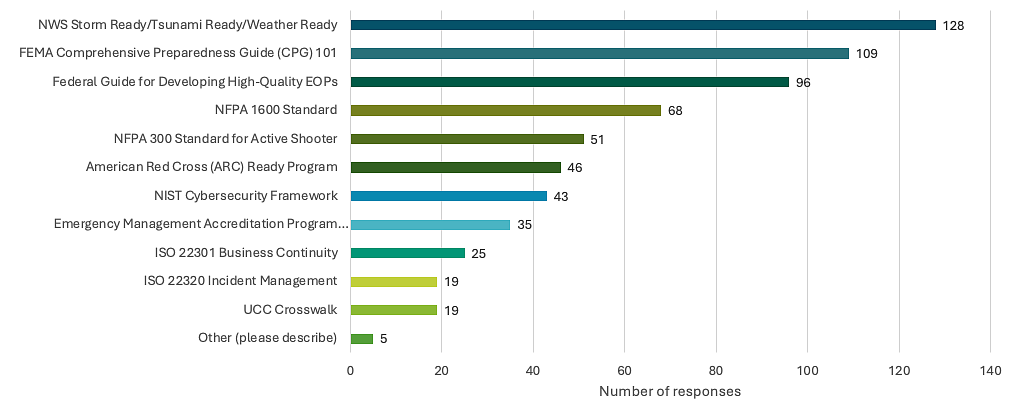
Standards | number of responses |
|---|---|
NWS Storm Ready/Tsunami Ready/Weather Ready | 128 |
FEMA Comprehensive Preparedness Guide (CPG) 101 | 109 |
Federal Guide for Developing High Quality EOPs | 96 |
NFPA 1600 Standard | 68 |
NFPA 300 Standard for Active Shooter | 51 |
American Red Cross (ARC) Ready Program | 46 |
NIST Cybersecurity Framework | 43 |
Emergency Management Accreditation Program (EMAP) | 35 |
ISO 22301 Business Continuity | 25 |
ISO 22320 Incident Management | 19 |
UCC Crosswalk | 19 |
Other | 5 |
Awareness of other organizations
Key takeaway: Here are resources that the respondents indicated they used the most as well as some organizations respondents said they were least familiar with.
- National Weather Service (NWS)
- Ready.gov
- Texas A&M Engineering Extension Service (TEEX)
- Disaster Resilient Universities (DRU) Network
- Centers for Disease Control and Prevention (CDC)
- Emergency Management Institute (EMI)
- International Association of Emergency Managers (IAEM)
- Readiness and Emergency Management for Schools (REMS)
- University Risk Management and Insurance Association (URMIA)
- National Center for Spectator Sports Safety and Security (NCS4)
- Campus Safety, Health, and Environmental Management Association (CSHEMA)
- National Domestic Preparedness Consortium
- Readiness and Emergency Management for Schools (REMS)
- The International Association of Campus Law Enforcement Administrators (IACLEA)
- Clery Center for Security on Campus
Top Challenges
Key takeaway: Respondents said the biggest challenges for emergency management programs are lack of resources/funding or lack of staffing. Low campus awareness or perceived importance of emergency management are also significant challenges for many, as is poor involvement or support from the campus community and executive leaders. Some respondents indicated that insufficient tools and technology are challenges.
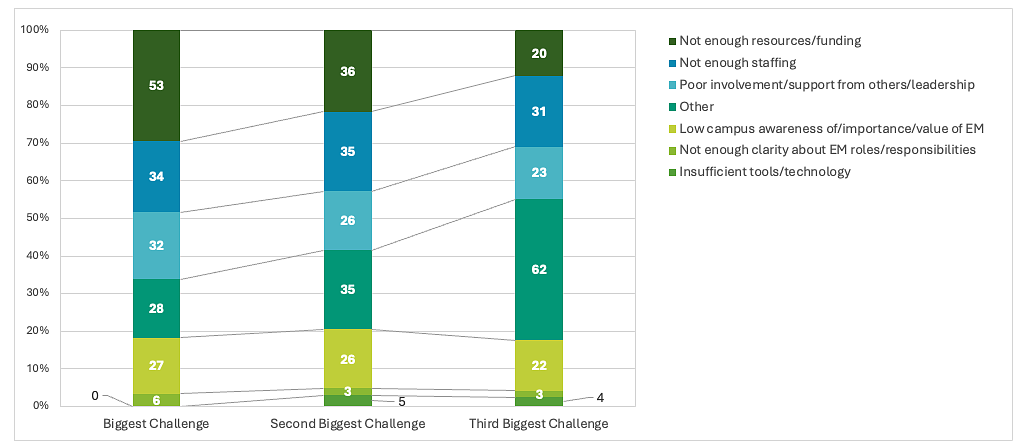
Challenge | Percentage of Respondents |
|---|---|
Not enough resources/funding | 53% |
Not enough staffing | 34% |
Poor involvement/Support from others/Leadership | 32% |
Other | 28% |
Low Campus Awareness of/importance/value of EM | 27% |
Not enough clarity about EM roles/responsibilities | 6% |
Insufficient tools/technology | 0% |
Challenge | Percentage of Respondents |
|---|---|
Not enough resources/funding | 36% |
Not enough staffing | 35% |
Poor involvement/Support from others/Leadership | 26% |
Other | 35% |
Low Campus Awareness of/importance/value of EM | 26% |
Not enough clarity about EM roles/responsibilities | 3% |
Insufficient tools/technology | 5% |
Challenge | Percentage of Respondents |
|---|---|
Not enough resources/funding | 20% |
Not enough staffing | 31% |
Poor involvement/Support from others/Leadership | 23% |
Other | 62% |
Low Campus Awareness of/importance/value of EM | 22% |
Not enough clarity about EM roles/responsibilities | 3% |
Insufficient tools/technology | 4% |
Respondents offered a variety of descriptions of emergency management's biggest challenges. Below are some examples:
- "Obtaining understanding of what the 'emergency management' function is, and probably more importantly, is not."
- "Commitment to exercise and drills."
- "Outdated plans, not enough time to spend on them."
- "Prioritization year-round and not when bad things happen."
- "Lack of prioritization."
- "Lack of interest."
- "The profession still doesn't have a sense of what/who it is."
- "Faculty attitudes and noncooperation."
- "Lack of awareness in campus communities of EM principles."
- "Demonstrating a value-add to senior leadership specifically during blue sky days."
- "Time- it takes an inordinate amount of time to make a change."
- "Conflicting priorities from senior leadership and EM."
- "Fundamental misunderstanding of what Emergency Management does."
- "Engagement of academic instructors and them understanding their role during crises."
Top Opportunities
Key takeaway: Respondents see a variety of opportunities for creating more robust emergency management programs. Popular ideas include improving the quality of core functions, as well as finding ways to rebrand and reposition emergency management. Several respondents also see opportunity in doing more work with the external agencies, professional development, and in pursuing external funding.
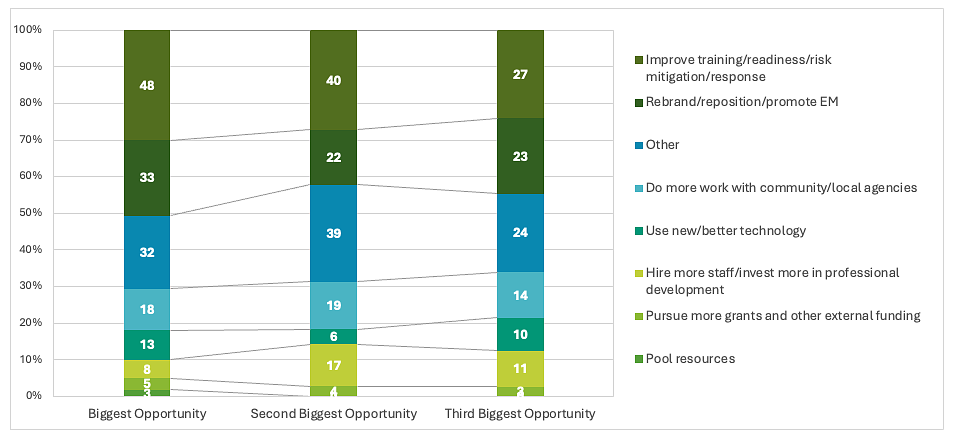
Opportunity | Percentage of respondents |
|---|---|
Improve Training/Readiness/Risk Mitigation/Response | 48% |
Rebrand/Reposition/Promote EM | 33% |
Other | 32% |
Do More Work With Community/Local Agencies | 18% |
Use New/Better Technology | 13% |
Hire More Staff/Invest More in Professional Development | 8% |
Pursue More Grants and Other External Funding | 5% |
Pool Resources | 3% |
Opportunity | Percentage of respondents |
|---|---|
Improve Training/Readiness/Risk Mitigation/Response | 40% |
Rebrand/Reposition/Promote EM | 22% |
Other | 39% |
Do More Work With Community/Local Agencies | 19% |
Use New/Better Technology | 6% |
Hire More Staff/Invest More in Professional Development | 17% |
Pursue More Grants and Other External Funding | 4% |
Pool Resources | 0% |
Opportunity | Percentage of respondents |
|---|---|
Improve Training/Readiness/Risk Mitigation/Response | 27% |
Rebrand/Reposition/Promote EM | 23% |
Other | 24% |
Do More Work With Community/Local Agencies | 14% |
Use New/Better Technology | 10% |
Hire More Staff/Invest More in Professional Development | 11% |
Pursue More Grants and Other External Funding | 3% |
Pool Resources | 0% |
Respondents identified a variety of opportunities for the emergency management field. Below are some examples:
- "Demonstrate value to and through campus leadership."
- "Developing national standards for best practices for an EM at an IHE, including plans, training schedules, and staffing levels."
- Collaboration with sister institutions - state/national."
- "Meet parent expectations."
- "Normalizing emergency management in higher ed."
- "Expand our capabilities to all crisis [sic], not just emergencies such as weather."
- "Focus on value-adding activities."
- "Develop a curriculum since it is now a career."
- "Growing education and professional opportunities."
- "Develop research on best practices."
- "Hiring professional emergency managers instead of retiring first responders who know little about emergency management."
- "Thought leadership (talks, presentations, papers)."
- "Grants and other funding sources."
Key Takeaways and Recommendations
Key Takeaways
Emergency management programs lack resources.
Many emergency management programs have taken on more in the last three years but their budgets and staff sizes have largely remained the same or decreased. It's no surprise, then, that survey respondents said their biggest challenge is resources, especially funding, staffing, and technology. Many respondents said their mitigation, continuity, and recovery plans need development or updates, and the number of respondents who said their IHEs have emergency management strategic plans has decreased since 2016. Awareness of best practices or sample plans may be a barrier for many.
Engagement in trainings and exercises is lagging.
Many respondents feel that emergency management programs offer inadequate training or exercises. Several mentioned a lack of leadership prioritization in supporting or participating in training designed to help the campus prepare for, mitigate, and recover from emergencies. IHEs have many critical issues that compete for limited resources and attention, but EM programs must look for innovative ways to link, leverage, and align training and exercise programs with day-to-day operations to ensure the most efficient use of limited resources.
Emergency management is struggling to define itself.
Many respondents said emergency management programs are searching for ways to raise awareness about their work and the value it adds to campus communities. Many are also seeking ways to define, support, and grow the IHE emergency management profession. Poor involvement or support from the campus community and executive leadership are significant challenges for many in this area.
Recommendations
Improve understanding of emergency management.
Campus leaders need to understand better the role of emergency management (EM) functions within institutions of higher education (IHEs), and it is essential to recognize that EM programs vary by IHE size and complexity. IHE leadership must clearly define the purpose and role of their EM programs to ensure alignment with institutional values, priorities, strategies, and mission. There is no one-size-fits-all approach; EM programs can range from focusing solely on emergency preparedness and response to more comprehensive programs that include continuity planning, mitigation, and recovery. It is crucial to understand what IHEs expect from EM programs now and in the future.
Create and share more plan guidance among IHEs.
Awareness of best practices or sample plans is a barrier to many IHEs. Creating a centralized, easy-to-access resource of national best practices, plan templates, and plan development tools could help IHEs create and/or update campus plans to prepare for, mitigate, operate during, and recover from emergencies. Templates and examples should be based on the differing sizes and complexity of IHEs rather than a one-size-fits-all solution. There is a need for a diversity of templates and examples.
Cultivate the emergency management profession.
Creating more professional development opportunities could grow and strengthen the pipeline of qualified people in the IHE emergency management field, bringing more innovation and resources to IHE emergency management programs. The DRU, IHEs, and other organizations could develop professional certification programs, institution accreditation programs, internship guides, and professional development books or courses.
About Us
Disaster Resilient Universities® Overview
Since 2005 the Disaster Resilient Universities® has served as a simple yet effective peer-to-peer network for university/college practitioners charged with overseeing campus emergency management, environmental health and safety, public safety, organizational resilience, and risk management.
In 2000, six post-secondary schools participated in the Federal Emergency Management Agency Disaster Resistant Universities pilot initiative. When funding was cut, several institutions of higher education kept the core concept of the DRU alive. They saw the need for a practical, common-sense approach to disaster prevention on their campuses. In 2005, the University of Oregon started the Disaster Resilient Universities® (DRU) Network listserv. The listserv quickly became the cornerstone of the DRU Network by providing multidisciplinary, practitioner-based resource and connections.
The goal of the DRU listserv is simple: facilitate open communication, discussion, and resource-sharing among university and college practitioners responsible for making campuses more disaster resilient.
The DRU Network does not have an operational budget. Collectively network members partner with each other and with professional associations to develop tools and resources for campuses. The DRU Network continues to seek partnerships with professional associations, campuses, and federal agencies to further the critical work of promoting campus disaster resilience.
In 2022 the DRU aligned with the Institute for Resilient Organizations, Communities, and Environments (IROCE) at the University of Oregon. IROCE is an applied research institute advancing interdisciplinary research, innovation, and partnerships toward action, making a practical difference in the resilience of organizations, communities, and the environment.
DRU Advisory Committee Members
- Amina Assefa, Director Emergency Management and Business Continuity, University of California
- Kristina Anderson Froling, Founder, Koshka Foundation for Safe Schools
- Bruce Brown, Associate Vice President, Safety and Business Continuity, The University of Texas Southwestern Medical Center
- Krista Dillon, Chief of Staff and Senior Director of Operations, Safety and Risk Services, University of Oregon
- Leo Howell, Vice President and Chief Information Security Officer, Georgia Tech
- Andre Le Duc, Founder and Administrator of DRU and Vice President and Chief Resilience Officer, University of Oregon
- Anne-Marie McLaughlin, Director of Emergency Management and Continuity, New York University
- Leigh Ann Moffett, Associate Vice President and Chief Risk Officer, Southern Methodist University
- Keith Perry, Associate Director EHS and Emergency Manager, Stanford University
- Bronwyn Roberts, Strategic Director of the U.S. Department of Education's Readiness and Emergency Management for Schools Technical Assistance Center
- Pascal Schuback, Executive Director, Cascadia Region Earthquake Workgroup (CREW)
- Brian Smith, Chief Ethics & Compliance Officer, University of California San Francisco