About the Survey
Why we did the survey
The past two years have been historic for institutions of higher education (IHEs) across the country. The COVID-19 pandemic has tested IHEs in ways we are still trying to understand. We have an opportunity to capture key learnings and continue advancing our shared mission of cultivating disaster resilience on our campuses.
We can build on the 2016 National Emergency Management Needs Assessment. The 2016 survey, done in partnership with the National Center for Campus Public Safety and our professional association partners, is now six years old. Now is a good time to resurvey practitioners and develop a cornerstone for future DRU activities.
The DRU is in a unique position to highlight shared issues around IHE emergency management, risk, and resilience. The DRU can evolve its core competencies to advance interdisciplinary partnership and disaster resilience in IHEs. Information from surveys such as this one can inform when and how DRU moves to the next level.
Survey Overview
Survey metadata
388 Total Respondents
48 Total Questions
76 Days (May 9-July 23, 2022)
Our Sponsors
University of Oregon Safety and Risk Services
iAEM USA Council Universities & Colleges Caucus
University Risk Management and Insurance Association
About the Survey Respondents
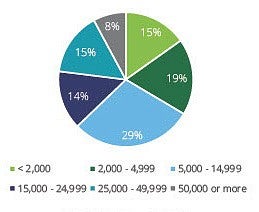
Total Student Enrollment
Student enrollment | Percentage of respondents |
|---|---|
50,000 or more | 8% |
25,000-49,999 | 15% |
15,000-24,999 | 14% |
5,000-14,999 | 29% |
2,000-4,999 | 19% |
<2,000 | 15% |
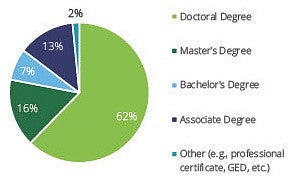
Highest Degree Offered
Degree Type | Percentage of respondents |
|---|---|
Doctoral Degree | 62% |
Master's Degree | 16% |
Bachelor's Degree | 7% |
Associate Degree | 13% |
Other (e.g. professional certificate, GED, etc.) | 2% |
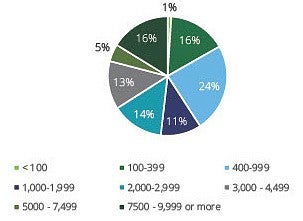
Total Faculty and Staff
Number of Faculty and Staff | Percentage of Respondents |
|---|---|
7,500-9,999 or more | 16% |
5,000-7,499 | 5% |
3,000-4,999 | 13% |
2,000-2,999 | 14% |
1,000-1,999 | 11% |
400-999 | 24% |
100-399 | 16% |
<100 | 1% |
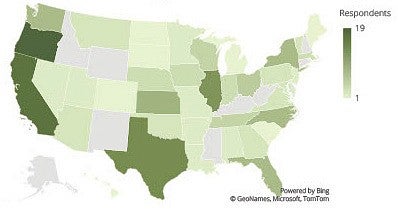
Geographic Distribution
- Oregon - 19
- California - 17
- Texas - 14
- Illinois - 13
- Kansas - 9
- Florida - 8
- New York - 8
- North Carolina - 8
- Washington - 8
- Ohio - 6
- Tennessee - 5
- Wisconsin - 5
- Indiana - 4
- Iowa - 4
- Massachusetts - 4
- Nebraska - 4
- Arizona - 3
- Georgia - 3
- Maryland - 3
- Montana - 3
- Oklahoma - 3
- Pennsylvania - 3
- Vermont - 3
- Virginia - 3
- Alabama - 2
- Arkansas - 2
- Louisiana - 2
- Minnesota - 2
- Missouri - 2
- Nevada - 2
- New Jersey - 2
- Utah - 2
- Colorado - 1
- Hawaii - 1
- Maine - 1
- Michigan - 1
- North Dakota - 1
- Rhode Island - 1
- South Carolina - 1
- South Dakota - 1
Additional information on our respondents
- 61% are public institutions
- 17% have a medical center and/or teaching hospital
- 51% are R1
- 21% are R2
- 28% are R3
- 83% are residential institutions
Key Takeaways
Enterprise Risk Management (ERM) Programs
Key Data
55% of respondents’ have ERM Programs and of those who have ERM Programs:
- 49% do not know what ERM framework they utilize
- 35% report to the VP/CFO
- 47% have more than 1.5 Full Time Equivalents (FTEs) dedicated to ERM
- 31% of respondents’ do not have an ERM program, but many maintain key ERM program elements
Insights
Respondents mentioned the following tasks to enhance their ERM program:
- Enhance risk training and education
- Utilize Risk Appetite, Risk Tolerance, and Key Risk Indicators
- Enhance current ERM processes
- Obtain leadership buy-in and participation
Emergency Management and Continuity of Operations Plans
Key Data
- 30% of respondents’ Emergency Management functions reside in the Public Safety Department
- 82% of respondents have Emergency Operations Plans (EOPs)
- 87% of respondents said they have Incident Management Teams (IMT)
Insights
Respondents Continuity of Operations Plans (COOP), Disaster Recovery Plans, and IMT Teams all had the same top 2 needs:
- Plan Maintenance and Support
- Training and Exercises
Leadership Response to COVID-19
Key Data
- 53% of respondents’ COVID Response leaders reported directly to the President/Chancellor
- 20% of respondents’ Emergency Management departments managed COVID response
- 14% of respondents’ noted that they did not have a Pandemic/disease plan
Insights
Respondents mentioned the following lessons from the COVID pandemic:
- Planning and ERM are needed
- Collaboration is necessary
- Communication is critical
- Assign roles and responsibilities
Key Theme and Findings: Enterprise Risk Management Programs
Key Takeaway
While most institutions have ERM programs, institutions leverage a variety of ERM frameworks, governance structures, and staffing levels.
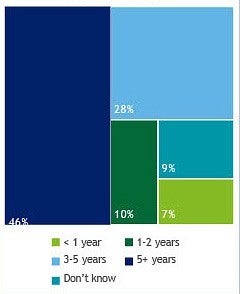
ERM Program Age
Age of Program | Percentage |
|---|---|
5+ years | 46% |
3-5 years | 28% |
1-2 years | 10% |
< 1 year | 7% |
Don't Know | 9% |
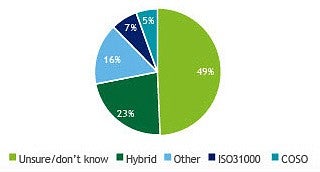
ERM Framework
Framework | Percentage |
|---|---|
COSO | 5% |
ISO31000 | 7% |
Other | 16% |
Hybrid | 23% |
Unsure/Don't Know | 49% |
Who ERM Reports to:
Who | Percentage |
|---|---|
VP/CFO | 33% |
Other | 21% |
CRO | 17% |
President/Chancellor | 16% |
Board of Trustees | 11% |
Don't Know | 1% |
Provost | 1% |

FTEs per ERM Program
Amount of FTE | Number of People |
|---|---|
0, 0.75 | 9 |
0.75, 1.5 | 31 |
1.5,2.25 | 20 |
2.25, 3 | 5 |
>3 | 11 |

67% of institutions that offer Doctoral Degrees have ERM Programs
77% of Institutions that have R1 or R2 classifications have ERM Programs
56% of public institutions have ERM programs
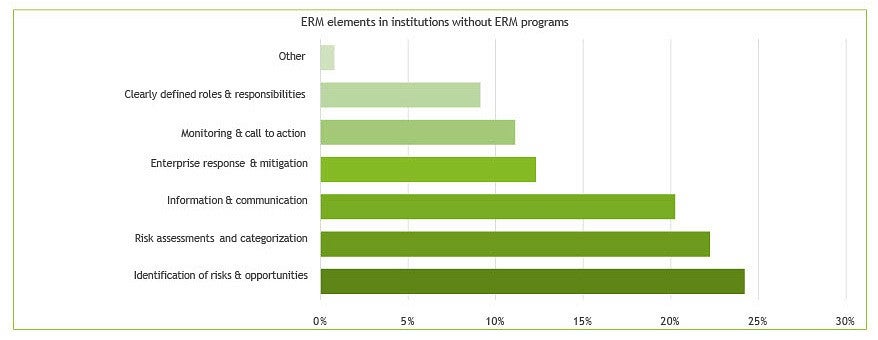
Key Takeaway
In institutions that do not have ERM programs, they do have some common ERM program elements.
ERM elements in institutions without ERM programs
ERM Element | Percentage |
|---|---|
Other | .79% |
Clearly defined roles and responsibilities | 9.13% |
Monitoring and call to action | 11.11% |
Enterprise response and mitigation | 12.30% |
Information and communication | 20.24% |
Risk assessments and categorization | 22.22% |
Identification of risks and opportunities | 24.21% |
Enterprise Risk Management Challenges and Projects
Key Challenges
- Difficulty obtaining buy-in or participation
- Lack of unified philosophy about risk
- Lack of funding
- Difficulty obtaining qualified staff
- Tying ERM to strategy and budget allocation
Key Projects
- Risk training and education
- Utilizing Risk Appetite, Risk Tolerance, and Key Risk Indicators
- Enhancing ERM processes
- Obtaining buy-in and participation
Key Theme and Findings: Campus Emergency Management
Campus Emergency Management Reporting Structure
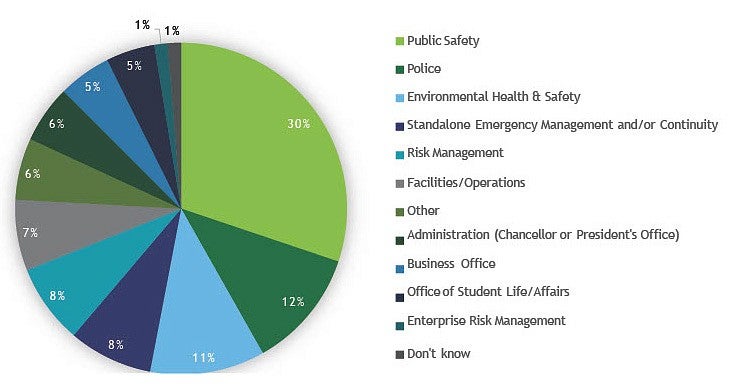
Almost half of the IHEs respondents report that emergency management reports to campus police and public safety departments.
Within which department does the emergency management function reside at your institution?
Department | Percentage |
|---|---|
Public Safety | 30% |
Police | 12% |
Environmental Health and Safety | 11% |
Standalone Emergency Management | 8% |
Facilities/Operations | 7% |
Other | 6% |
Administration (Chancellor or President's Office) | 6% |
Business Office | 5% |
Office of Student Life/Affairs | 5% |
Enterprise Risk Management | 1% |
Don't Know | 1% |
Common EM Program Elements
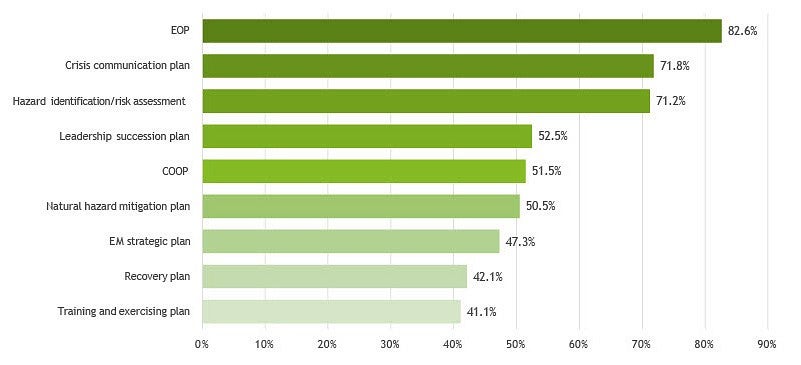
Most respondents have EOPs, crisis communication plans, hazard assessment plans, and leadership succession plans.
About half have a COOP and natural hazard mitigation plans; fewer have EM strategic plans, recovery plans, or training plans.
Institutional EM Program Plan Components
Component | Percentage |
|---|---|
EOP | 82.6% |
Crisis Communication Plan | 71.8% |
Hazard identification/risk assessment | 71.2% |
Leadership succession plan | 52.5% |
COOP | 51.5% |
Natural hazard mitigation plan | 50.5% |
EM strategic plan | 47.3% |
Recovery plan | 42.1% |
Training and exercising plan | 41.1% |
COOP Plan Needs
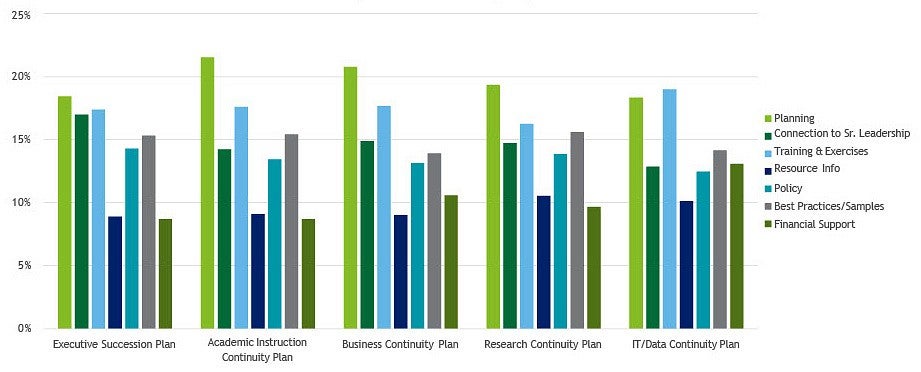
Planning and training are top needs for IHEs' continuity of operations plans, especially for academic instruction continuity plans, business continuity plans, and IT/data continuity plans.
Areas of Improvement for Continuity of Operations Plans
Area of Improvement | Planning | Connection to Sr. Leadership | Training and Exercises | Resource Information | Policy | Best Practices/ Samples | Financial Support |
|---|---|---|---|---|---|---|---|
Executive Succession Plan | 18% | 17% | 17% | 9% | 14% | 15% | 9% |
Academic Instruction Continuity Plan | 22% | 14% | 18% | 9% | 13% | 15% | 9% |
Business Continuity Plan | 21% | 15% | 18% | 9% | 13% | 14% | 11% |
Research Continuity Plan | 19% | 15% | 16% | 11% | 14% | 16% | 10% |
IT/Data Continuity Plan | 18% | 13% | 19% | 10% | 12% | 14% | 13% |
Disaster Recovery Plan Needs
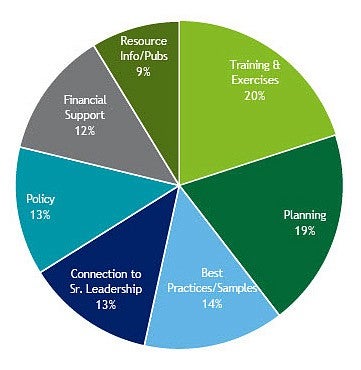
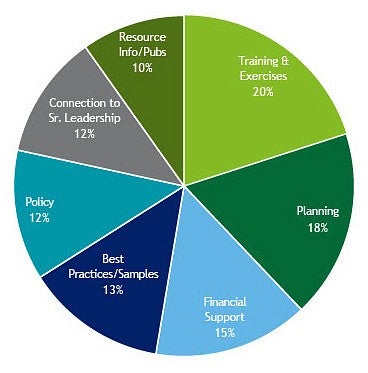
IHEs told us they have a variety of competing needs for making their disaster recovery plans successful.
Operational/Facilities Recovery Plan Needs
Needs | Percentage |
|---|---|
Training and Exercises | 20% |
Planning | 19% |
Best Practices/Samples | 14% |
Connection to Senior Leadership | 13% |
Policy | 13% |
Financial Support | 12% |
Resource Information/Publications | 9% |
IT/Data Recovery Plans Needs
Needs | Percentage |
|---|---|
Training and Exercises | 20% |
Planning | 18% |
Financial Support | 15% |
Best Practices/Samples | 13% |
Policy | 12% |
Connection to Senior Leadership | 12% |
Resource Information/Publications | 10% |
IMTs and Crisis Response Teams
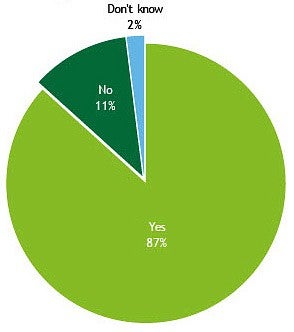
About 11% of respondents said they did not have IMTs and Crisis Response Teams. The most popular need for success: Training.
Does your EM program have IMT Team?
- 87% Yes
- 11% No
- 2% Don’t Know
Top IMT Needs
- Training/Exercises
- Plan Maintenance/Support
- Staffing
- Funding
Key Theme and Findings: Dispersed COVID-19 Pandemic Leadership
Dispersed COVID Leadership
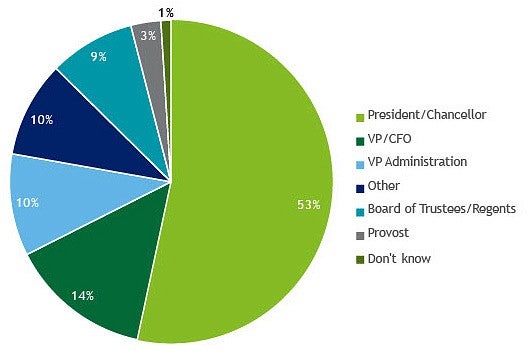
Leadership approaches varied during the COVID-19 pandemic, but challenges and lessons learned were more consistent.
Who did/does the institutional COVID-19 response leader primarily report to on your campus?
Who | Percentage |
|---|---|
President/Chancellor | 53% |
VP/CFO | 14% |
VP Administration | 10% |
Other | 10% |
Board of Trustees/Regents | 9% |
Provost | 3% |
Don't Know | 1% |
COVID Day-to-Day Response Lead
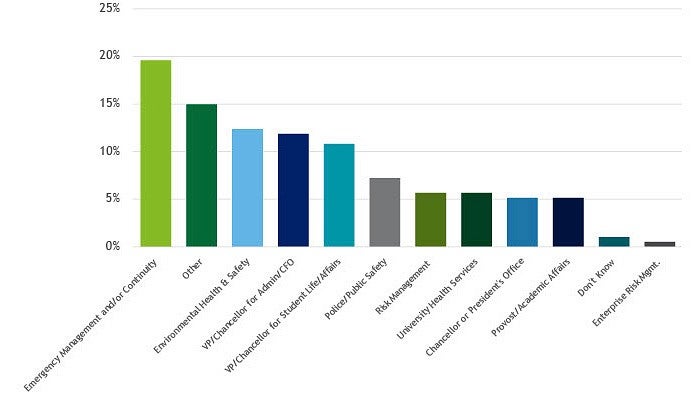
Only about 1 in 5 respondents said their Emergency Management department handled their IHE’s COVID-19 response.
Department Lead of COVID-19 Response
Department | Percentage |
|---|---|
Emergency Management and/or Continuity | 19.59% |
Other | 14.95% |
Environmental Health and Safety | 12.37% |
VP/Chancellor for Admin/CFO | 11.86% |
VP/Chancellor for Student Life/Affairs | 10.82% |
Police/Public Safety | 7.22% |
Risk Management | 5.37% |
University Health Services | 5.67% |
Chancellor or President's Office | 5.15% |
Provost/Academic Affairs | 5.15% |
Don't Know | 1.03% |
Enterprise Risk Management | .52% |
67% of respondents said their IHEs either hired more employees (33%) or redeployed existing employees (34%) to help with COVID-19 response.
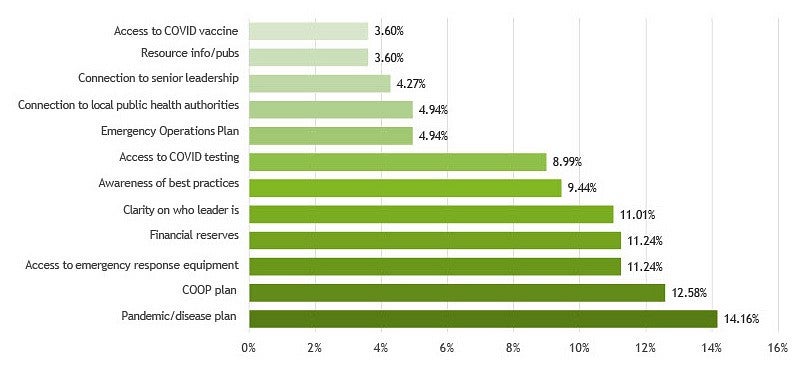
COVID Response Gaps
Lack of a plan, lack of PPE, lack of money, and lack of clarity about who was in charge were the biggest COVID-19 pandemic challenges for the respondents.
What resources did your institution most lack regarding providing an effective emergency response to COVID-19?
Resource | Percentage |
|---|---|
Access to COVID vaccine | 3.60% |
Resource information/publications | 3.60% |
Connection to senior leadership | 4.27% |
Connection to public health authorities | 4.94% |
Emergency Operations Plan | 4.94% |
Access to COVID testing | 8.99% |
Awareness of best practices | 9.44% |
Clarity on who leader is | 11.01% |
Financial reserves | 11.24% |
Access to emergency response equipment | 11.24% |
COOP plan | 12.58% |
Pandemic/disease plan | 14.16% |
Challenges and Lessons from COVID
Key Challenges
- Difficulty incorporating remote work/instruction
- Resource shortages/delays
- Difficulty obtaining qualified staff
- Information shortages/delays
- Uncertain/unpredictable/inconsistent mitigation measures/decisions
Key Lessons
- Importance of Planning
- Collaboration is necessary
- Communication is critical
- Leadership duties are important
DRU Opportunities and Recommendations
Key Issues and Opportunities
The survey data and interviews highlight six specific issues and opportunities for IHEs and for the DRU.
- IHEs want short, accessible training and research. The survey results indicate high demand for training, but interviewees noted that much of what’s available is time-consuming, overly complex, and impractical for busy risk professionals.
- IHEs need better help creating plans. The survey results suggest that many IHEs lack emergency or risk management plans simply because they don’t have the staff or resources to create them.
- IHEs want more ways to compare notes. Sharing information is crucial to developing best practices. The survey results and interviews indicate that IHEs need more ways to share what they’re doing.
- IHEs need help finding and funding qualified people who are excited about risk and emergency management. The survey results suggest IHEs want to do more to manage risk comprehensively but are struggling to fill positions.
- IHEs want someone to consult with about specific issues. The survey results indicate that emergency management and risk staffs are often small, leaving few internal channels for guidance.
- IHEs might benefit from more comprehensive guidance about emergency and risk management. Several organizations specialize in specific areas of emergency and risk management.
From the interviewees: “I wish that there was a centralized organization that just focused on emergency management in higher education.”
From the interviewees: “What can we do as the DRU to make sure that there are templates out there, or directions, or sharing best practices in these areas to kind of help some of these schools out…”
Recommendations
Here are six potential things the DRU can do to evolve its core competencies, as well as advance interdisciplinary partnerships and disaster resilience in IHEs.
- Create and offer short, simple training products. University leaders don’t have the time for three- day classes; DRU could address the demand for more efficient training.
- Conduct frequent surveys about specific topics and share the findings quickly. This could help quantify and disseminate generally accepted best practices.
- Create and offer short, simple plan templates, how-to checklists, and easy-to- understand best practices. Offering periodic, perhaps automated nudges could remind participants to stay on track or complete key steps.
- Provide a safe space for sharing ideas, wins, and problems. Webinars, videos, interviews, panel participation, roundtables, and the current listserv can help peers connect in a more meaningful, productive way about specific, sensitive topics.
- Become a hub for recruiting and DEI efforts in the emergency and risk management field. Staffing is a significant issue for IHEs, and the DRU could leverage its existing infrastructure to help IHEs find qualified candidates.
- Become a center for matching subject- matter experts with IHEs. The DRU can provide consultant-like services to IHEs that want help with a specific emergency management issue or topic.
About the Authors
This document was written and prepared by André Le Duc and Amanda Curler.
André is the founder and administrator of the DRU. He is also the Vice President for Safety and Risk Services and Chief Resilience Officer and at the University of Oregon and Director of the Institute for Resilient Organizations, Communities, and Environments.
Amanda is the Associate Director, Enterprise Risk Management at the University of Oregon.
Funding Support
This survey and report were made possible through generous support from Deloitte & Touche LLP